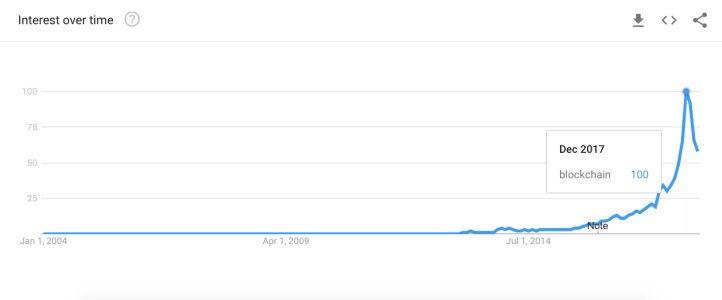
Peak Blockchain as seen through Google Trends
A diagram with time as the x-axis and 0%…100% as the y-axis. The graph remains flat at 0% until ca. 2013, grows almost exponentially to 100% until the end of 2017, and declines steeply after the turn of the year to ca. 50%.
